Produce graphs and various charts of historical barometric data for a location to aid in visualization of pressure changes quickly for (possible) prediction of health effects from the change in weather pressure.
programming
Posted on:
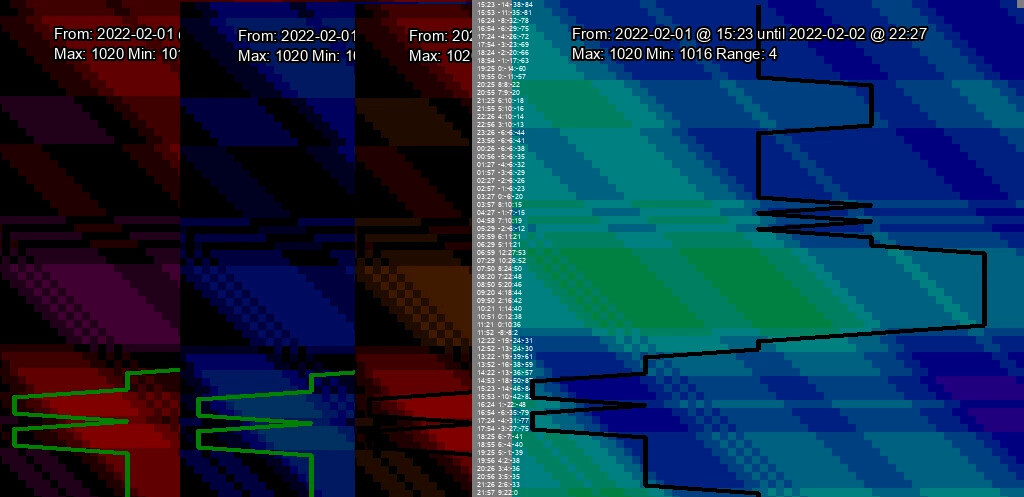
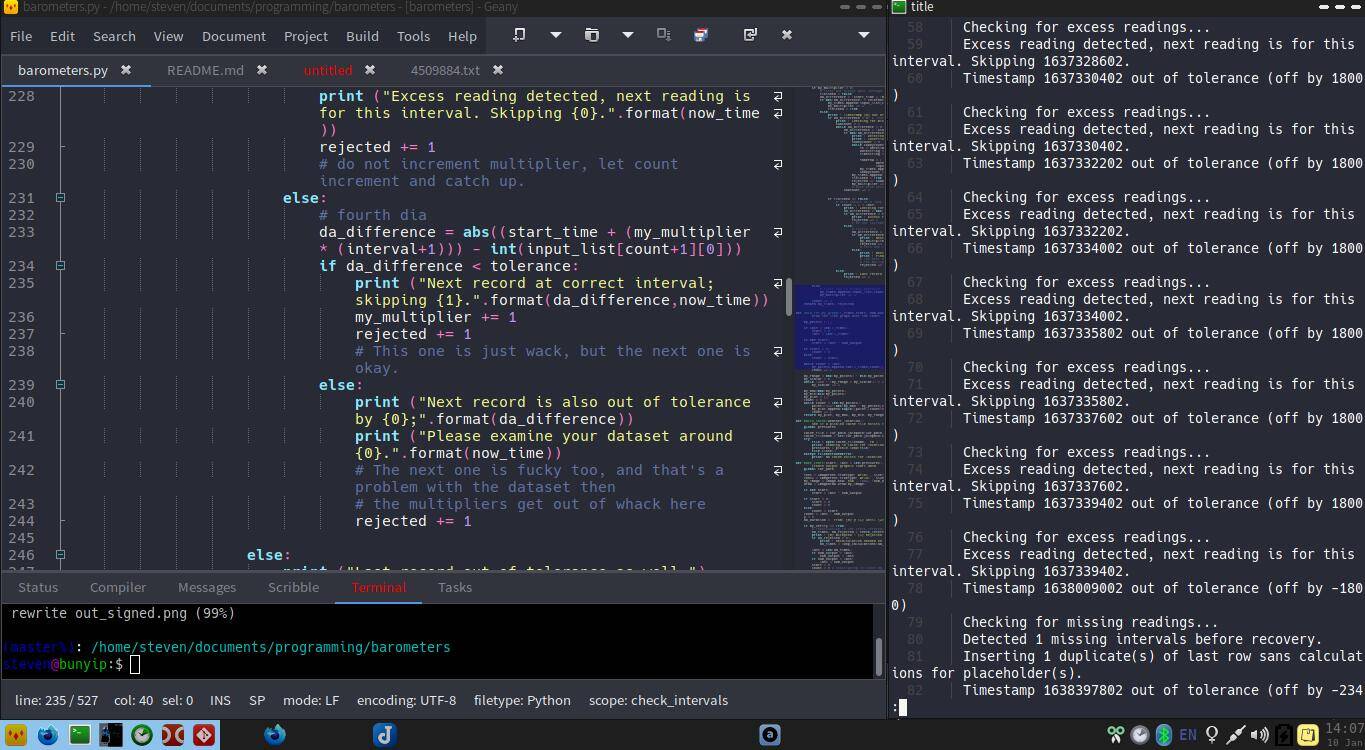
Added Data Verification to Barometric charting program
My unusual way of charting barometric data can now verify the data and autoheal datasets to a limited extent.
health / programming / technology
Posted on:
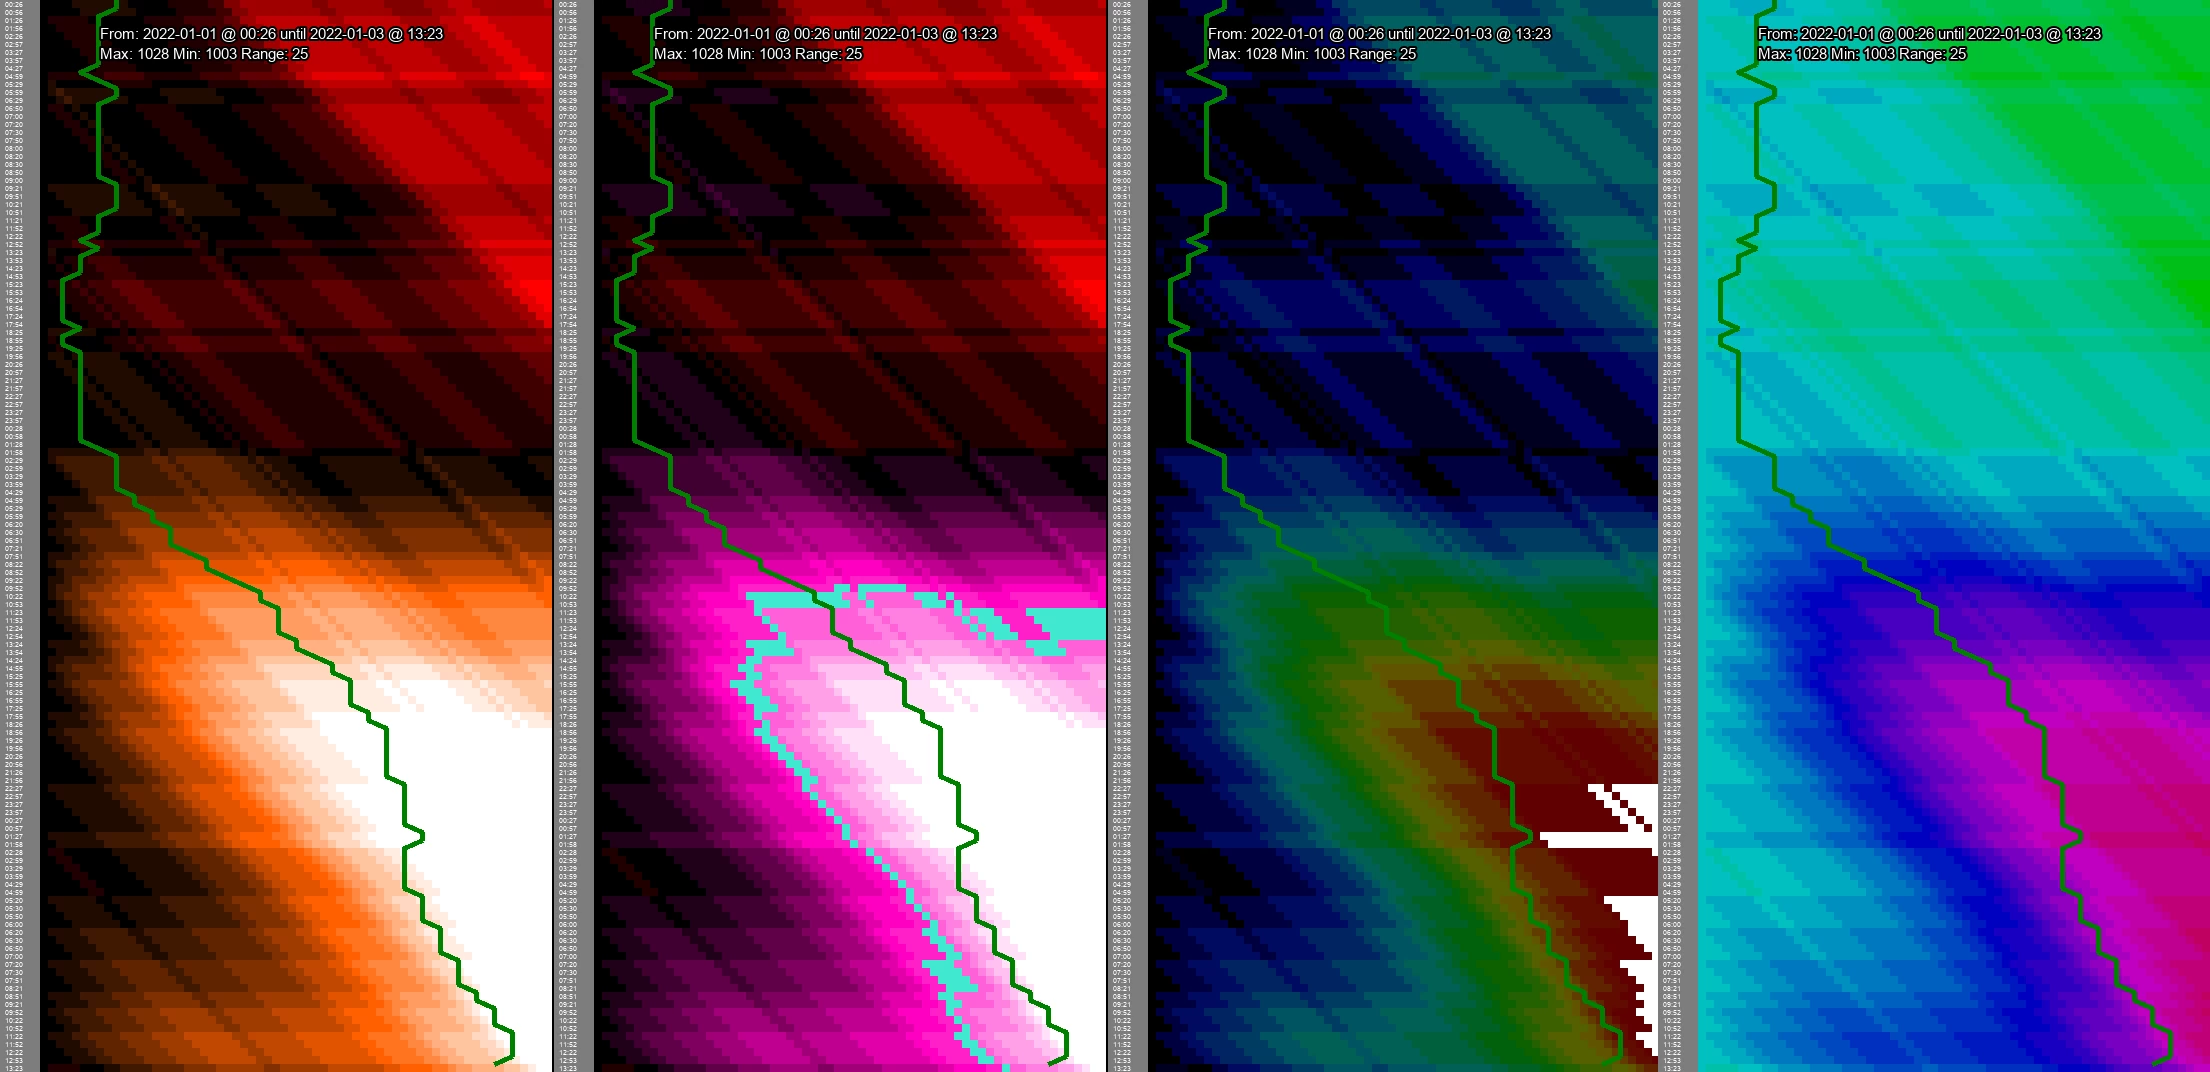
Learning Python in A Week And More On Pressure Changes
A different way to look at barometric data – including a python program to produce these charts for yourself.
health / technology
Posted on:
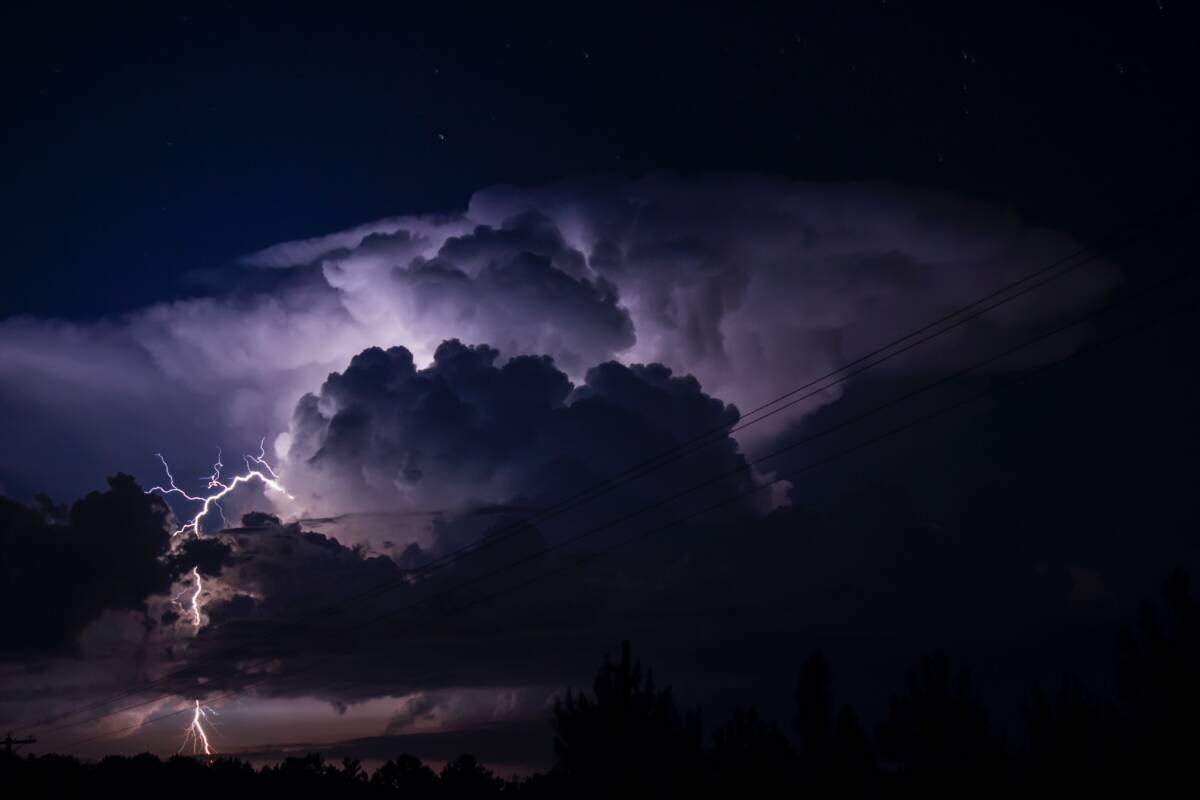
Data Hiding In Plain Sight: Pain And Pressure Changes Over Time
This is a story that will be useful for those suffering from conditions that are affected by barometric pressure, and also for any kind of researcher. Seriously.