
So I taught myself Python properly over the course of last week, rewrote the program, and am able to share it with you now. It not only has time labels (left hand side), but can show an overlaid line graph of the pressures (auto-scaled), you can choose to display as much or as little data as you like (including optional selection of date ranges), it runs a lot faster, automatically cleans, deduplicates, and caches data, can chart absolute values of changes or signed values of changes, can show the collected data and calculations for any range of data, and has several color schemes to suit your fancy.
Whew.
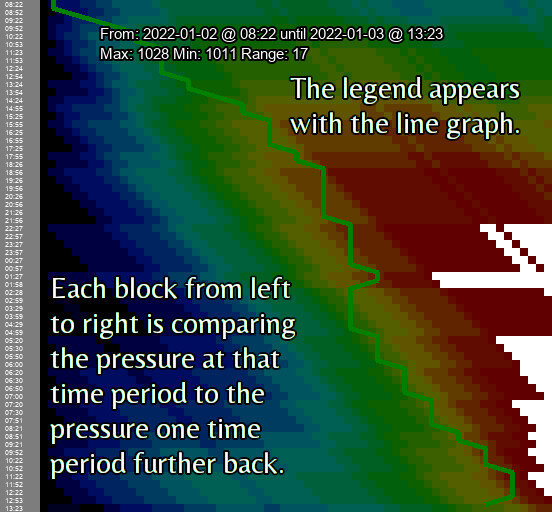
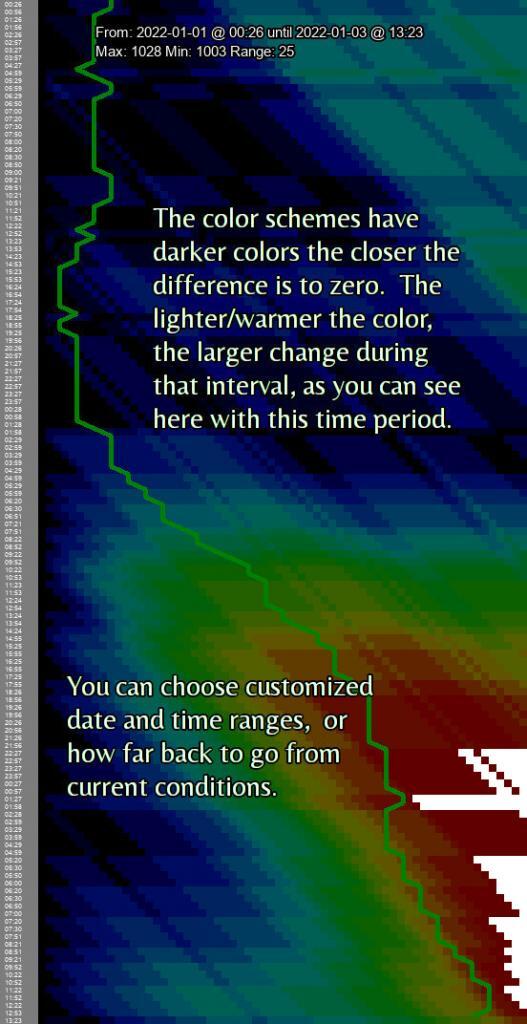
As a reminder, what we’re looking at is the relative change in barometric pressure compared to the pressure further back in time. As you go from left to right in each row, you’re comparing to a further back period.
Doing this in Python means it runs a lot faster than what I had scripted before, and gives me a lot more flexibility on how to visualize this data.
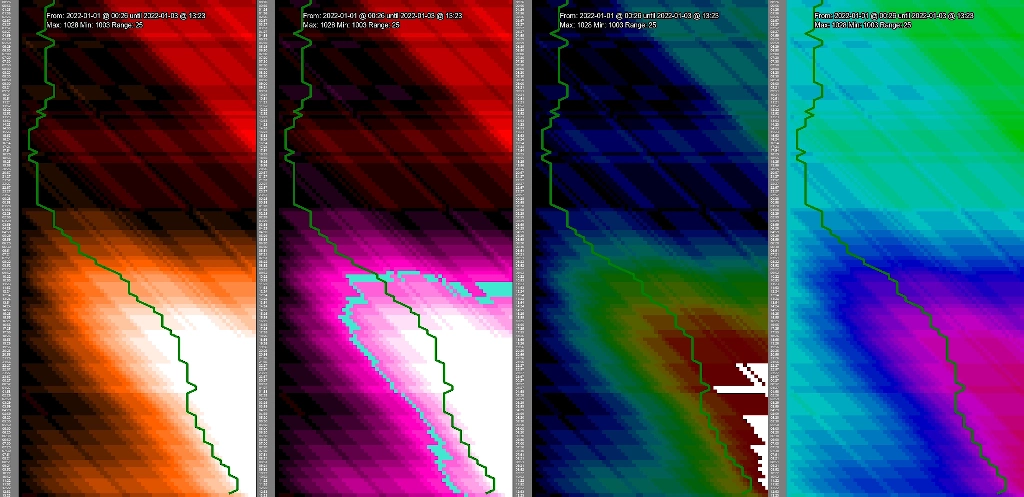
It also made it pretty easy to provide different color schemes as well to help visualization:
As it stands now, the program will read in, clean, de-duplicate, and cache data each run automatically. You can then visualize different ranges of data (including selecting by date!), and have a number of ways to output that data. (You do have to collect/scrape the data yourself, but the mentioned bash script does that, and a small sample set of data is included.)
The program itself is written in Python3 and only requires the PIL/Pillow external library and should work cross-platform. Data collection is still written in bash (it’s a subset of my weather.sh script) though I intend to fix that.
This is only really my second Python program (and the only one where I actually learned how it works and used a textbook and all), so I’m sure it can be optimized, but I’m pretty happy with how it’s working right now. All the options and such are kind of detailed, so take a look at it over on GitHub, GitLab, or my personal git repository.