In an effort to make my barometers program more useful to more people, I realized there needed to be a way to verify the data – both when reading it in, and when displaying it, with as much auto-healing as possible.
I’m happy to announce the 0.9.1 release ("It works on my computer") where I’ve incorporated both of those features into the script, along with a way to run the script without input data and just generating graphs and charts from the cached data, and choosing which data to view by city code.
I know the source code is not entirely "pythonic" in style; part of it is that I want to be super redundant and careful with the data rather than just going "Oh, well, error here…", and part is that I’m learning while writing this and there’s lots of room for optimization. But I’m still pretty happy of what I’ve been able to do in my spare time over two weeks and going from a low level of proficiency to being somewhat proficiency in python in that span of time.
Currently the program:
- reads in and caches barometric data gathered by the just_pressures.sh script
- outputs charts of absolute value and signed values of barometric pressure over time
- outputs line graph overlay
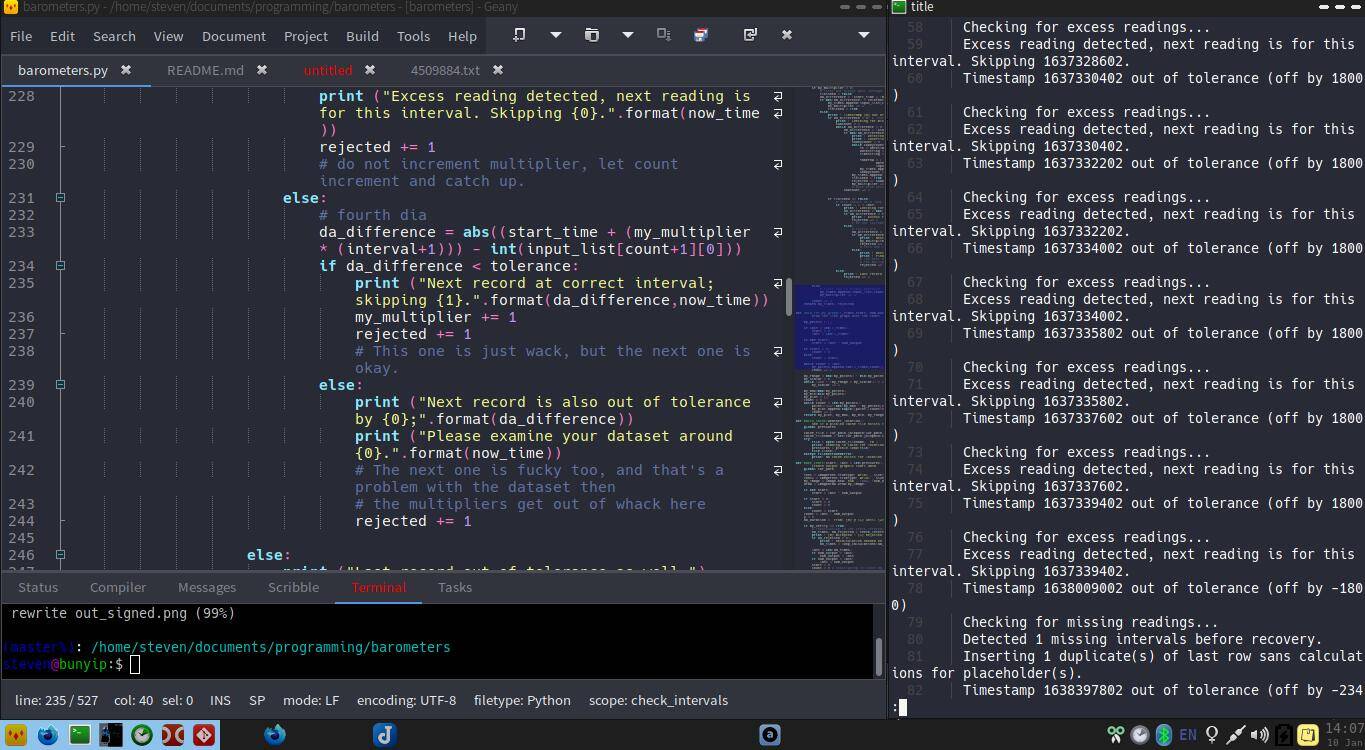
- can verify input data and (limitedly) self-heal dataset including missed and excess data
- can verify output data and (limited) self-heal dataset to display
without altering cache - can select city code from the cached data to use for output
- fix bug from tag 0.9.0 when display size not explictly set or selected
output too small.
It is available at Github, Gitlab, and my git repository.
(Featured image is really my desktop.)