Produce graphs and various charts of historical barometric data for a location to aid in visualization of pressure changes quickly for (possible) prediction of health effects from the change in weather pressure.
programming
Posted on:
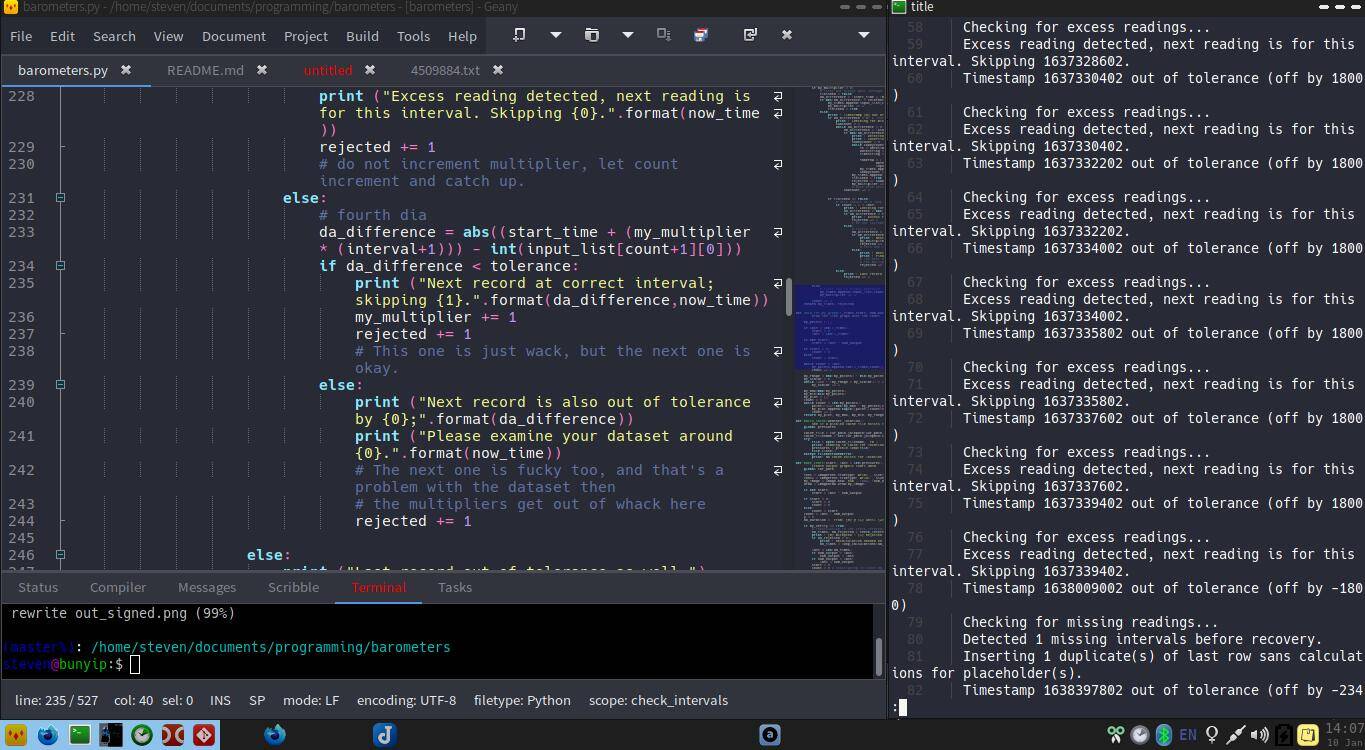
Added Data Verification to Barometric charting program
My unusual way of charting barometric data can now verify the data and autoheal datasets to a limited extent.
health / programming / technology
Posted on:
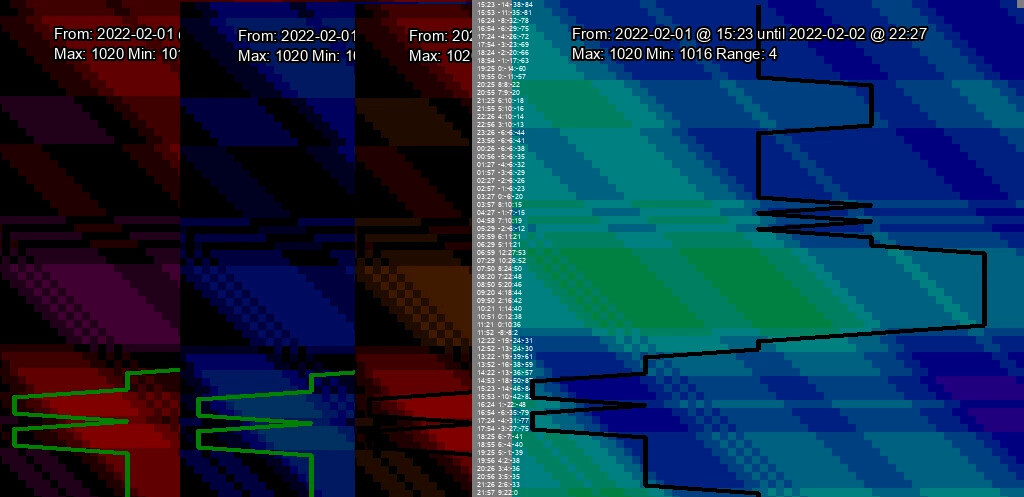
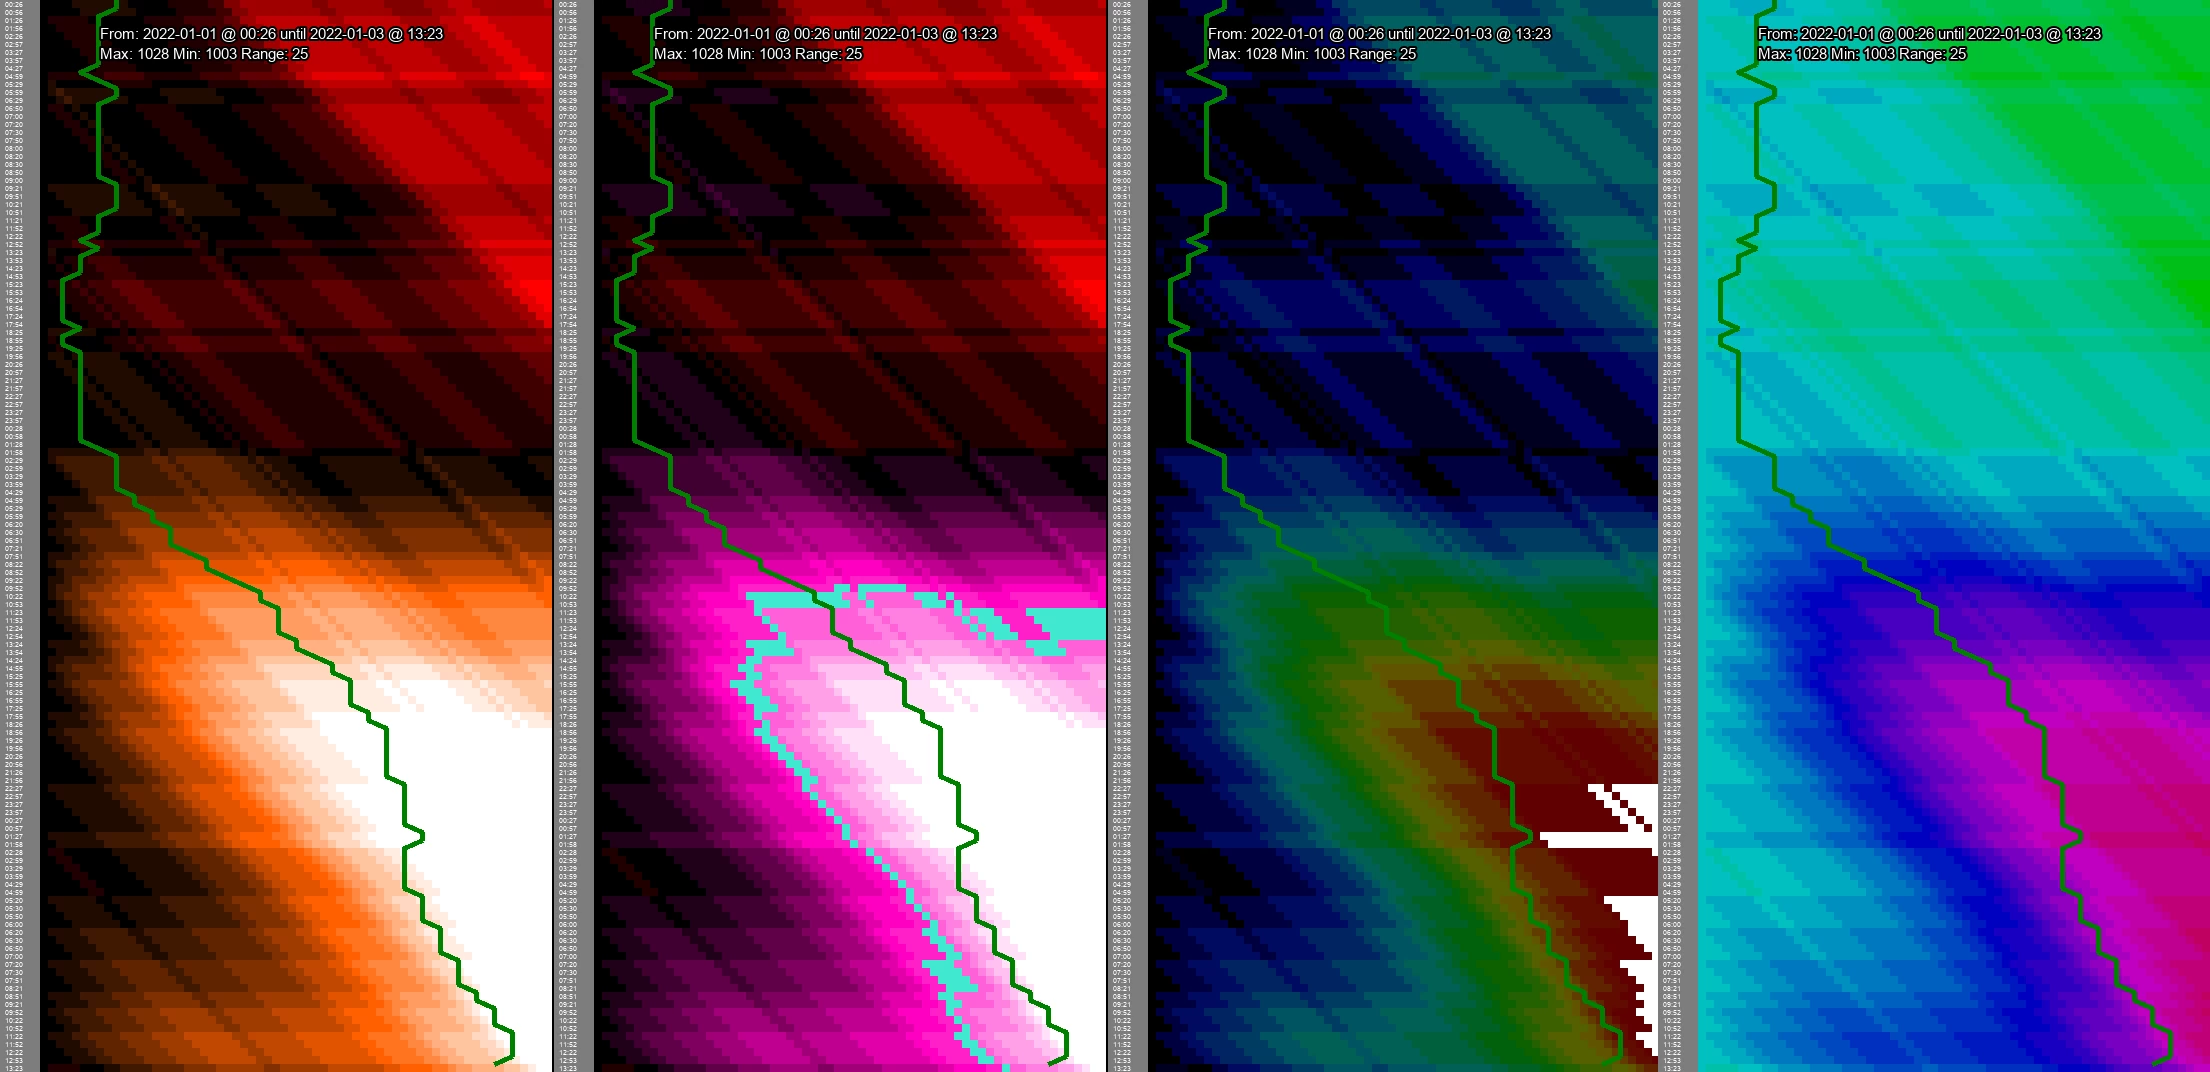
Learning Python in A Week And More On Pressure Changes
A different way to look at barometric data – including a python program to produce these charts for yourself.

music / recommendation / software
Posted on:
Automatically Find Cover Art With Smart Automatic Cover Art Downloader (Crossplatform)
SACAD is a multi platform command line tool to download album covers without manual intervention, ideal for integration in scripts, audio players, etc.