
I was diagnosing a problem on my server the other day, and I realized that I didn’t know how much memory all the various apache processes were using up. I did some researching, and while there’s solutions out there, I wanted a simple tool that would allow me to see the top five commands using memory or CPU on my machine.
I ended up with two scripts – topmem and topcpu – that are most definitely not replacements for other tools like top or ps, but they give me the information I need. And they’re bash (leveraging common utilities like awk, cut, sort, uniq, and bc) so you can easily tweak them however you like.
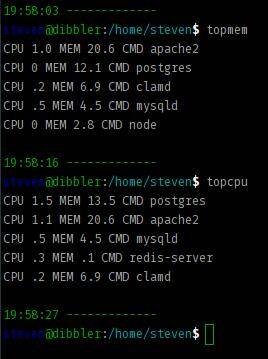
While these aren’t exactly speedy or optimized, they do what I want;
they show me the top five memory using (or CPU using, respectively)
commands. That is, it lumps all vivaldi-bin or firefox-bin
processes together before doing the calculation and sort. That way I can
see what commands are eating up everything.
A small note – processes from bash, python, and java (at present) are not excluded, but the command they’re running is what is counted. So for example, these three commands:
/usr/bin/python /usr/share/kupfer/kupfer.py --no-splash
/usr/bin/python /usr/bin/autokey-gtk
/usr/bin/python /usr/bin/dstat -c -C 0,1,total -d -s -n -y -r
are not lumped together, but are treated as separate commands.
You can find the scripts as part of my multiple_scripts repository on GitHub, GitLab, or my own Git server.
This Article was mentioned on stevesaus.com