[Steve’s note: This is a compendium post. Please link to this one, okay? The raw SPSS data (it’ll open in PASW as well) is here. Click to embiggen graphs and tables. If you’ve enjoyed this or found it useful, please subscribe to my RSS feed, follow me on Twitter,, or become
a fan on Facebook.]
Recently, Jim C. Hines did a survey of 246 authors about how they sold their first novel and what actions they’d taken before they sold it. Why? Because you’ll hear people tell you that you must have sold short stories and have an agent and meet a publisher… or tell you exactly the opposite. So he asked. And then I asked him if I could take a crack at the data myself and see if I uncovered something with correlations, regressions, and other statistical goodness.
Jim gave me the raw (anonymized) data, and it turns out I sorted things out a little bit differently than he did. Which brings us to section 1:
Coding
Executive summary: Jim and I grouped the responses slightly differently. This did cause some slight differences in aggregate statistics.
There were 246 distinct respondents to the survey. This was a convenience sample, though with the many categories of this population, it would be difficult to create a truly representative random sample. Some issues that need to be dealt with up front are as follows:
One survey question was “How many times, if any, was your novel rejected before it sold to a professional publisher?”. Due to responses both in the survey itself and in communications outside the survey instrument, an unknown number of respondents were confused about this question. Since we known the responses are not consistent between respondents, I scrapped the information and didn’t use it. Which is a pity.
For the question “In what genre was your first professional novel sale?”, several respondents placed multiple genres. To best reflect current bookstore practices, the following guidelines were used in coding these responses:
- Any response that included “Young Adult” was treated as “Young Adult” alone (e.g. “YA/Mystery” became “Young Adult”).
- Any response that indicated marketing for children (i.e. “Middle-school”) was treated as “Young Adult”.
- Any response that included “Tie-in” was treated as “Tie-in” alone (e.g. “Tie-in/Sci-Fi” became “Tie-in”).
- Any response that included “Romance” was treated as “Romance” alone (e.g. “Paranormal Romance” became “Romance”).
- “Paranormal”, “Occult”, and other descriptive terms that were not explicitly “Horror” were treated as “Urban Fantasy”.
- Any genre with less than three responses was folded into “Mainstream/Literary”.
Please note that this classification is different than the one that Jim used.
For the question “How did you sell your first novel to a professional publisher?”, the following guidelines were used to code the data:
- Any response that included “Self-published, then sold to a larger publisher” (n=1) was treated as a small press publication.
- There were many (n=30) responses in the dataset that were listed as “Other”. These values were treated as missing, and not calculated.
One further note: There were a few outliers in numbers of short stories sold; respondents who reported selling more than 10 short stories before the first novel was normalized to 10.
General Correlations
Executive summary: Those who sold more short fiction were only slightly more likely to have sold their first novel to a publisher or small press directly (and there’s a big, BIG caveat attached to that) and were more likely to have attended week-long writing workshops. And older writers were slightly more likely to have been writing longer, attended cons, writer’s groups, and weekend- and week-long writing workshops. The later the year of first publication, it was slightly less likely the author had been referred by a mutual friend to a publisher or agent.
Using the “Correlations” feature in stats programs is often a way to find out where to look more closely. That really was the case here; the correlations found were pretty weak and few were actually significant.
Correlations were sought between “How many short fiction sales, if any, did you have before making your first professional novel sale?” using Pearson’s Product Moment Correlation). Though not the appropriate statistic, this table suggested the direction for further analysis. There were only significant correlations with “How did you sell your first novel to a publisher” (rho(246)=0.21, p=0.001) and “Have you attended a week-long workshop” (rho(246)=0.13, p=0.05). BIG CAVEAT: I must caution that both of these are weak correlations, and this statistic is not applicable to nominal level data, and are largely presented here for completeness alone.
The table of correlations also demonstrated some rather obvious (though not strong) associations: Older writers were more likely to have been writing longer (rho(246)=0.17, p=0.006), attended cons (rho(246)=0.18, p=0.004), writer’s groups (rho(246)=0.18, p=0.004), and both weekend-long (rho(246)=0.27, p=0.001) and week-long workshops (rho(246)=0.2, p=0.001).
The year of publication also had some interesting associations, with significant weak negative correlations to being referred by a mutual friend to a publisher (rho(246)= -0.17, p=0.007) or agent (rho(246)= -0.13, p=0.04). These vaguely suggest that these factors had less of a role in more recent years, but that is not conclusive.
Crosstabulation
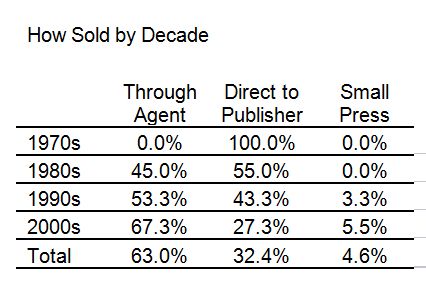
Executive Summary: Using percentages, we see that agented sales are increasing for first novel sales, especially in the last decade. Disregarding genre, about half the respondents per decade had sold no short stories at all before selling their first novel. Since the 80’s, the other half of authors have sold more short stories before selling their first novel. Across time, there seems to be no relationship between how many short stories were sold and the method of selling the first novel. Years of writing has a significant, weak, positive relationship to both the number of short stories sold and the number of books written prior to the first novel sale.
 When you look at the entire sample by decades (2000s includes the year 2010), an interesting trend appears. We see that in our sample, agented sales increased approximately ten percent by decade. This illustrates (and confirms) a common perception that direct-to-publisher sales are decreasing in frequency. While small press sales have grown for the entire sample, they are not replacing direct-to-publisher sales. It should be noted that the chi-square value was not significant (with alpha at the 0.05 level) for this crosstabulation. That means these variables noted are independent of each other (or they are not related to each other).

When examining the number of short story sales (before the sale of the first novel) by decade of sale of the first novel, we see that the percentages have not changed very much in the last two decades (1970s data is skewed by the few responses from authors who first published in that decade). The number of authors who sold a novel without selling any short stories has hovered around 50% since the 1980’s; the significant difference is how many authors had sold more than one short story. The collected data suggests that selling a short story has not a prerequisite for selling a novel since the 1980s.


It is impossible to show causation here; however, this researcher is inclined to wonder how many more short stories were written in the 1990s and 2000s by persons trying to work the conventional wisdom that one must write a short story to get a novel published. It should be noted that the chi-square value was not significant (with alpha at the 0.05 level) for this crosstabulation. That means these variables noted are independent of each other (or they are not related to each other).
Leaving the longitudinal data for a moment, we can look at the number of short stories sold by how the first novel was sold. There are no clear trends emerging from the data here, although I believe this is due to the differences between genres. Again, it should be noted that the chi-square value was not significant (with alpha at the 0.05 level) for this crosstabulation. That means these variables noted are independent of each other (or they are not related to each other).


At the suggestion of Ken Schneyer I used Spearman’s rho to evaluate correlations between years of writing before the first novel sale and short fiction sales before first novel (rho(246)= 0.23, p=0.001) and years of writing before first novel sale and number of books written before first novel (rho(246)= 0.19, p=0.002). So while there is a significant association between the two, it is rather weak. This can be seen on the scatterplot graphs (Note: these graphs exclude outliers, the calculations do not.)


Genre Breakdown
Executive summary: The sample is highly skewed towards YA, fantasy, sci-fi, romance, and urban fantasy. This influenced which genres sold greater percentages of their first novels in which decade.Honestly, the table and graph here speak volumes. This is an artifact of the convenience sample, which Jim is well aware of. Because of the number of responses (or lack thereof), I did not analyze data for groups other than YA, fantasy, sci-fi, romance, and urban fantasy. As mentioned in the first post, I considered “YA” to trump other groups.
This produces a sort-of artifact when you look at genre by what decade the first novel was sold. YA really cuts into the last decade. I say that it’s a “sort-of” artifact, because while I don’t buy into the idea that YA is really a “genre”, it is definitely treated that way by booksellers and (presumably) publishers as well. Ask Scott Westerfeld – Midnighters is urban fantasy, Uglies
is sci-fi, Leviathan is alternate history, Peeps
is horror… but I’ve found them all in the YA section.


How First Novel Was Sold – by Genre & Decade
Executive summary: YA and fantasy have been selling a greater percentage of first novels through agents in more recent years. Sci-fi seems to be going back and forth. Romance has had more direct-to-publisher sales lately. Urban fantasy is still overwhelmingly agented, but is branching out. There is no uniform rule or trend.
Much like the first bit, the charts and tables tell the story pretty well. I think this breakdown really starts to illustrate how segmented the publishing business can be – what holds for sci-fi in one decade may have no relationship to romance in the same decade – or to either in the next decade. While trends seem to be present, I strongly suspect that this is because of forces external to publishing (such as fads, trends, or evolving markets).
It should be noted that the chi-square value was not significant (with alpha at the 0.05 level) for all crosstabulations. That means these variables noted are independent of each other (or they are not related to each other).
…And now, the charts and tables:


Short Story Sales, Method of Sale, and Year
Executive Summary: There’s no real relationship between number of short stories before the first novel sold, not even when separated out by genre and time. The only real relationship is that (with the exception of urban fantasy) authors who sold more short stories tended to sell to small presses or to agents. It is likely (though I cannot prove causation) that this is because those who have sold more short stories have been writing longer and are more exposed to both agents and are more familiar with small presses.
There’s only three graphs today, and no tables. Largely, this is because the tables for this output does not add anything to the visual elements, and is a hell of a lot more confusing. (That and I remembered how to make SPSS chart multiple things at once.) The first relationship I would like to look at is the year of first novel sale by the (average) number of short stories sold by authors who sold their first novel in that year.

This is obviously not normalized data; there were a few individuals that strongly skewed the averages for a few years. (Remember that averages are more susceptible to being skewed by outliers than medians or means.) Regardless, there’s no real evident trend – and the stats behind this relationship have completely nonsignificant chi-squares, let alone any measures of association.
So what if we break it down by genre? (Again, these are averages per year of first novel sold.)

As with the data in part three, I concentrated on YA, science fiction, fantasy, romance, and urban fantasy. The outliers are very, very clear here, though we do see that more people are selling more short stories before their first novel in the last few years. I discussed this slightly in part two; half of the respondents had sold no short stories prior to their first novel sale, but more people had sold more short stories since the 1980’s. As someone who enjoys short stories, I think this is a great thing… but it seems to bear more relationship to authorial habits (and advice to authors) than having any predictive value. The statistics were once again completely nonsignificant.
That leaves us the only thing that seems to have any relationship at all (though I caution that the statistics are still nonsignificant):

The average number of short stories sold by how the first novel was sold seems to have some kind of relationship in all genres except for urban fantasy. People who sold their first pro novels through agents or small presses had sold more short stories first. I conjecture that this is a “soft” relationship, and that the exception of urban fantasy proves the rule. (Yes, I know the real meaning of that phrase.)
The strong exception of urban fantasy here would seem to play merry hell with my associations here, but I’m not sure about that. The basic trend seems to be that people who have sold more short stories are more familiar with publishing, and so use agents and small presses more. (This also fits with my own experience; I was largely unaware of small presses until I started writing more.) Urban fantasy is different, but I suspect this has to do with the “hotness” of the genre in the last decade or so. The perceived demand for urban fantasy would lead agents (in particular) to snag novelists. If you look back at the final graph for part three, that seems to be the case with the vastly disproportionate number of agented sales.
Networking – Length of Writing Time
Executive Summary: Attending conventions was the only significant variable that lessened the number of years writing before selling the first novel. Several other factors raised the number of years writing – but we don’t know which happened first, so cannot show causation.
As I mentioned before, “number of rejections” cannot be used here because respondents indicated that they did not measure the same thing consistently. (Mentioned in part one. [LINK]) What I’m using instead is “How many years had you been writing before you made your first professional novel sale?”. It’s an imperfect substitute, as we’re about to see.
 16.2% of the variance in the number of years writing before first novel sale can be explained by these “networking” factors; that sounds big, but remember that it’s variation, not reduction. The residual graph looks okay (over there on the right), but not good>. For someone who had not written another book, not sold any short fiction, not attended conventions, writer’s groups, gotten a degree in English (of any kind), attended workshops, or knew editors or agents, it was 10.36 years from when they started writing until their first professional novel was sold. This was significantly altered by five variables:
- Attending conventions reduced the number of years writing before first novel sale by 2.5, ceteris paribus.
- Selling the first novel without an agent increased the number of years writing before first novel sale by 3.3, ceteris paribus.
- Attending week-long workshops increased the number of years writing before first novel sale
by 3.9, ceteris paribus. - Attending more than week-long workshops increased the number of years writing before first novel sale by 4.7, ceteris paribus.
- Being introduced to a publisher by a mutual friend increased the number of years writing before first novel sale by 4.6, ceteris paribus.
I am strongly tempted to say that the first two are “real” – that is, that attending conventions makes it easier to sell your first novel (by talking to other authors/publishers and so on – if nothing else, cons always get me more enthused about writing) and that trying to sell your first novel without an agent will be somewhat harder. The other relationships – workshops and being introduced to a publisher – are significant, but I don’t believe they’re causative. Week long (and longer) workshops are not for the casual author – they’re a significant investment of time and money. I suspect that relationship is because those authors had been doing it for a while and wanted to (or needed to) hone their craft further. (Or in simple terms: I do not believe that going to a long workshop makes it harder to sell your first novel; I think you may not realize that you need to go to one until you’ve been writing for a while.) I don’t know what to make of “being introduced to a publisher”, though.
(here’s hoping the table doesn’t break the layout)
| Model | Unstandardized Coefficients | Standardized Coefficients | t | Sig. | Collinearity Statistics | |||
|---|---|---|---|---|---|---|---|---|
| B | Std. Error | Beta | Tolerance | VIF | ||||
| 1 | (Constant) | 10.355 | 1.074 | 9.639 | .000 | |||
| Which of the following had you done beforemaking your first novel sale?_Attended conventions | -2.500 | 1.258 | -.148 | -1.987 | .048 | .656 | 1.525 | |
| Which of the following had you done beforemaking your first novel sale?_Attended a week-long writing workshop | 3.862 | 1.633 | .167 | 2.365 | .019 | .738 | 1.355 | |
| Which of the following had you done before making your first novel sale?_Attended a longer ( > 1 week)writing workshop |
4.704 | 1.682 | .176 | 2.798 | .006 | .920 | 1.087 | |
| What connections did you have, if any, thathelped you find your publisher?_Introduced/referred by a mutual friend | 4.628 | 1.756 | .177 | 2.636 | .009 | .817 | 1.224 | |
| What connections did you have, if any, thathelped you find your agent?_I sold my book without an agent | 3.286 | 1.278 | .174 | 2.571 | .011 | .799 | 1.252 | |
| a Dependent Variable: How many years had youbeen writing before you made your first professional novel sale? | ||||||||
That’s it! Thanks for hanging out with me, and if you’ve enjoyed, please subscribe to my RSS feed, follow me on Twitter,, or become
a fan on Facebook!
Steven;
Thank you for doing all this work to put this together. And of course, thanks to Jim Hines for running the survey and letting you pull apart the data.
I look forward to more posts from you and reading your blog.
Cheers!
William Cliffe
Thanks for the kind words, William!