We’re continuing our multi-day trek into the data Jim C Hines collected. You can read part one here Today, we’re going to look at crosstabulations using the entire sample. This is somewhat similar to the work Jim did… but not quite. Click to embiggen graphs and tables.
Crosstabulation
Executive Summary: Using percentages, we see that agented sales are increasing for first novel sales, especially in the last decade. Disregarding genre, about half the respondents per decade had sold no short stories at all before selling their first novel. Since the 80’s, the other half of authors have sold more short stories before selling thier first novel. Across time, there seems to be no relationship between how many short stories were sold and the method of selling the first novel. Years of writing has a significant, weak, positive relationship to both the number of short stories sold and the number of books written prior to the first novel sale.
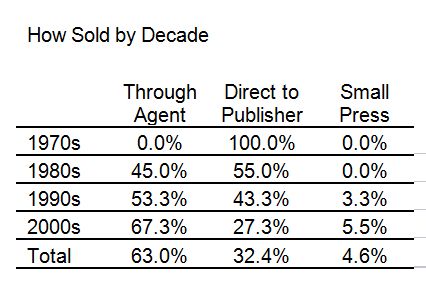
 When you look at the entire sample by decades (2000s includes the year 2010), an interesting trend appears. We see that in our sample, agented sales increased approximately ten percent by decade. This illustrates (and confirms) a common perception that direct-to-publisher sales are decreasing in frequency. While small press sales have grown for the entire sample, they are not replacing direct-to-publisher sales. It should be noted that the chi-square value was not significant (with alpha at the 0.05 level) for this crosstabulation. That means these variables noted are independent of each other (or they are not related to each other).

When examining the number of short story sales (before the sale of the first novel) by decade of sale of the first novel, we see that the percentages have not changed very much in the last two decades (1970s data is skewed by the few responses from authors who first published in that decade). The number of authors who sold a novel without selling any short stories has hovered around 50% since the 1980’s; the significant difference is how many authors had sold more than one short story. The collected data suggests that selling a short story has not a prerequisite for selling a novel since the 1980s.


It is impossible to show causation here; however, this researcher is inclined to wonder how many more short stories were written in the 1990s and 2000s by persons trying to work the conventional wisdom that one must write a short story to get a novel published. It should be noted that the chi-square value was not significant (with alpha at the 0.05 level) for this crosstabulation. That means these variables noted are independent of each other (or they are not related to each other).
Leaving the longitudinal data for a moment, we can look at the number of short stories sold by how the first novel was sold. There are no clear trends emerging from the data here, although I believe this is due to the differences between genres. Again, it should be noted that the chi-square value was not significant (with alpha at the 0.05 level) for this crosstabulation. That means these variables noted are independent of each other (or they are not related to each other).


At the suggestion of Ken Schneyer I used Spearman’s rho to evaluate correlations between years of writing before the first novel sale and short fiction sales before first novel (rho(246)= 0.23, p=0.001) and years of writing before first novel sale and number of books written before first novel (rho(246)= 0.19, p=0.002). So while there is a significant association between the two, it is rather weak. This can be seen on the scatterplot graphs (Note: these graphs exclude outliers, the calculations do not.)


Next time, we’ll start looking at results by genre.