So I’ve now successfully run three crowdfunding campaigns, and there’s one thing that was really striking across them… and it had to do with video plays for each project.
These are for Streets of Shadows, What Fates Impose, and Steampunk World, in that order.


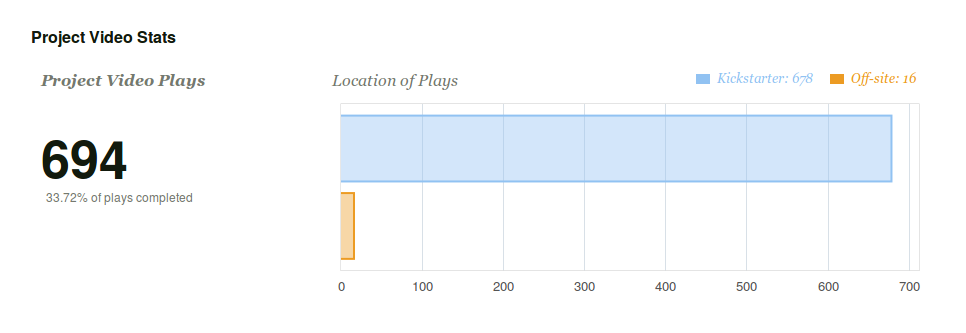
Yeah, hopefully you weren’t distracted by the colored columns or the big bold numbers – because they aren’t the important parts.
Underneath the big black number is perhaps the more important value – the number of plays completed. These videos have very different lengths. Here’s a quick chart of the relevant values:
| Time in Seconds | Percent Completed Plays |
| 62 | 33.72 |
| 198 | 18.43 |
| 328 | 6.78 |
While it’s a small dataset (three points), plotting it kind of looks like this:

Even with three datapoints, I think the relationship is pretty straightforward. Short, sweet, and to the point.
If you’ve run a crowdfunding campaign, please leave the values for your length-of-video and % completed plays in the comments so we can get more robust data for everyone!
(PS – this is the tool I used to make the graph: https://www.alcula.com/calculators/statistics/correlation-coefficient/)
#sfwapro